Dashboards
See the current state of your program, backed by result data
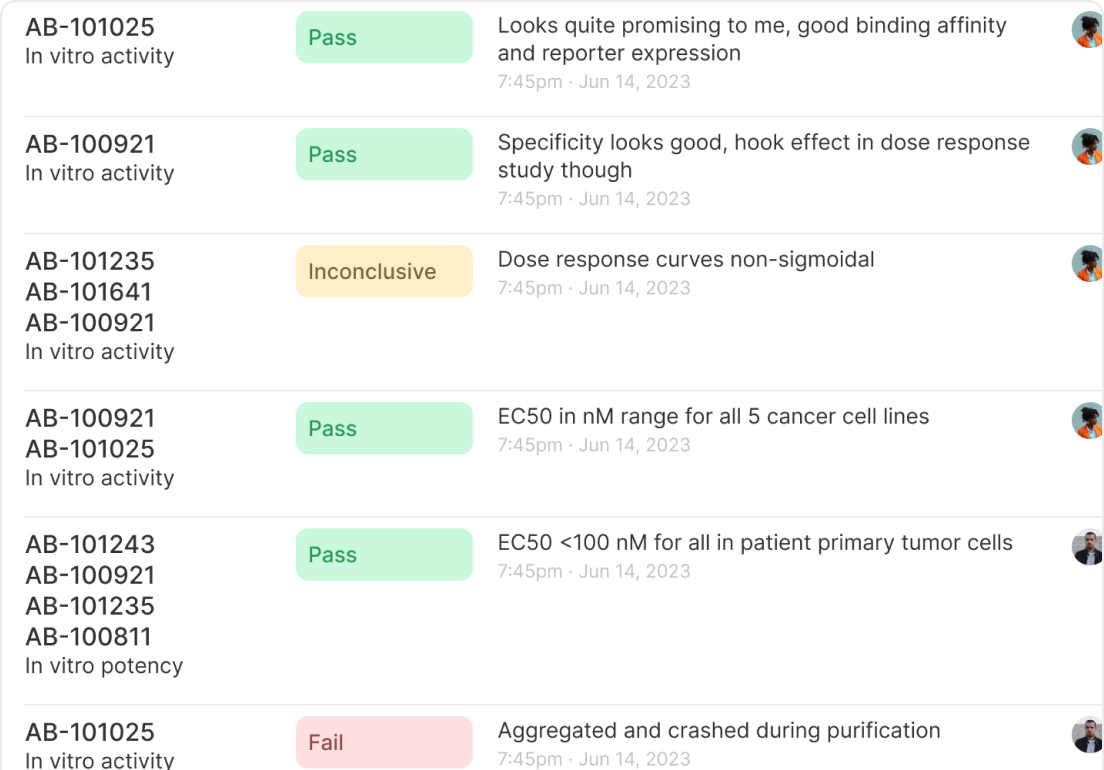
Decisions backed by data
Pass/Fail decisions for each category connected with critical evidence
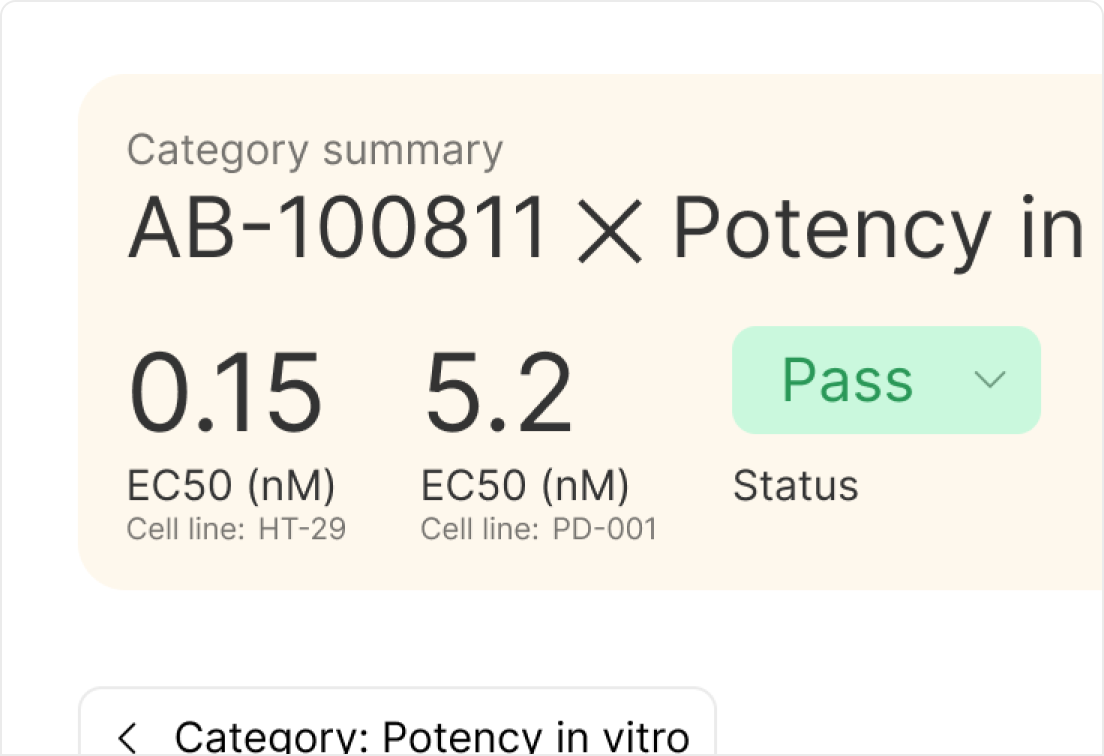
See highlighted data
Surface the most critical data points needed to make a decision
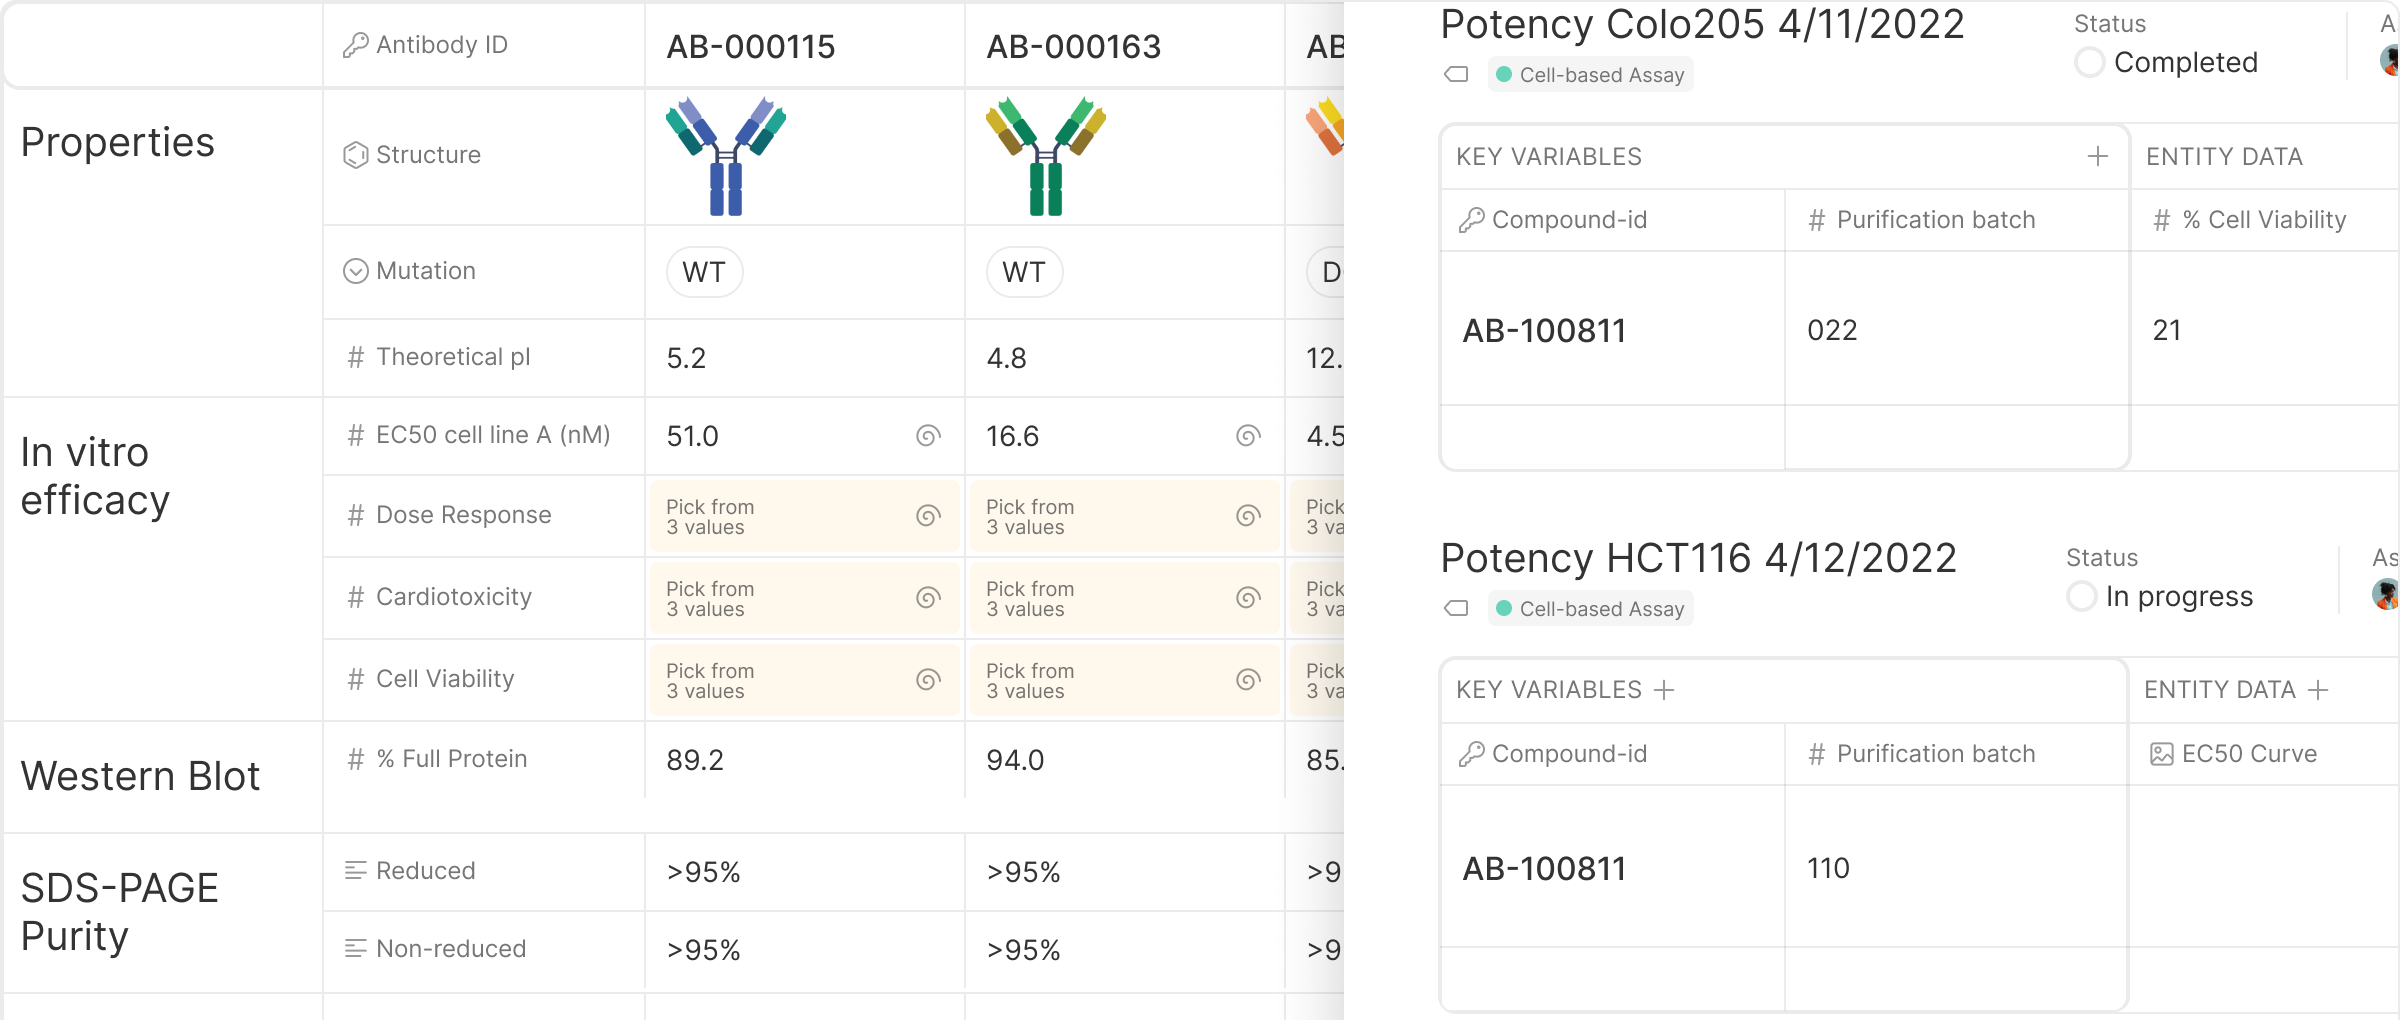
Detailed data attached
A dedicated place for raw data, ELN notes, prism files, etc
Drive your weekly review meetings
Review data
See an executive summary of progress and dive into data highlights
Make decisions
Dive into all new data to review and mark new decisions
Action next steps
Request assays on the spot with specific entities and conditions
Summarize results with roll-ups
Roll-up many experimental results...
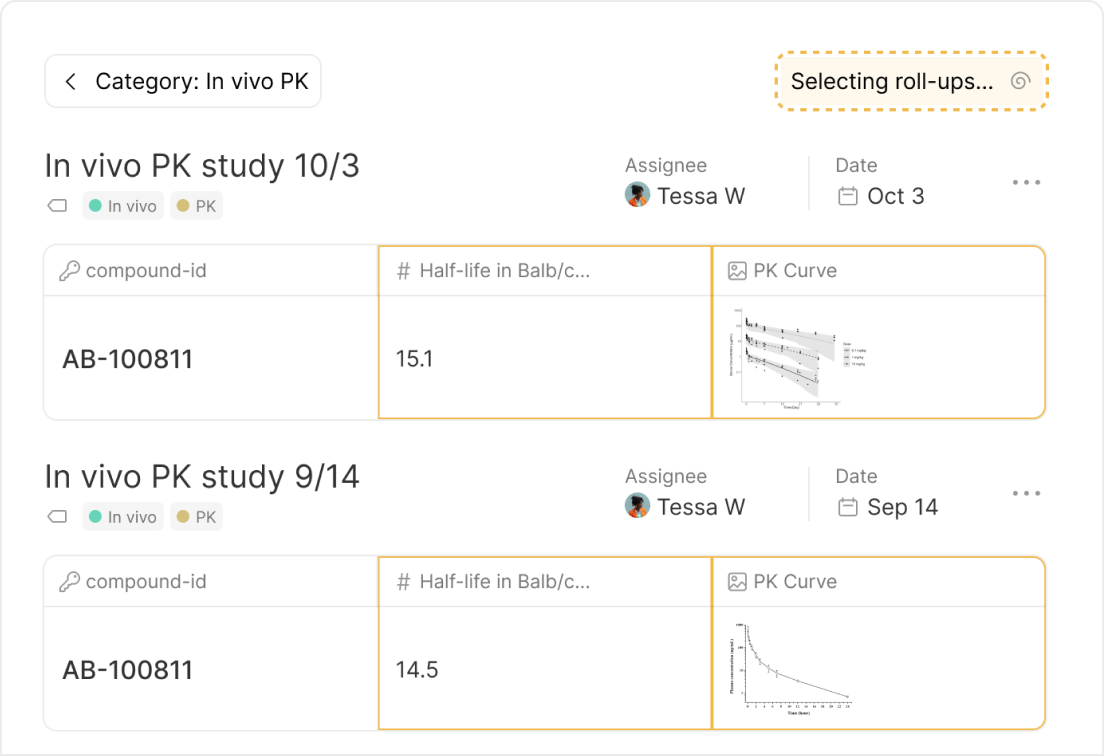
...annotate, and pin to decisions
Create & reuse data comparison dashboards
Create custom categories
Add critical fields
Compare any entities
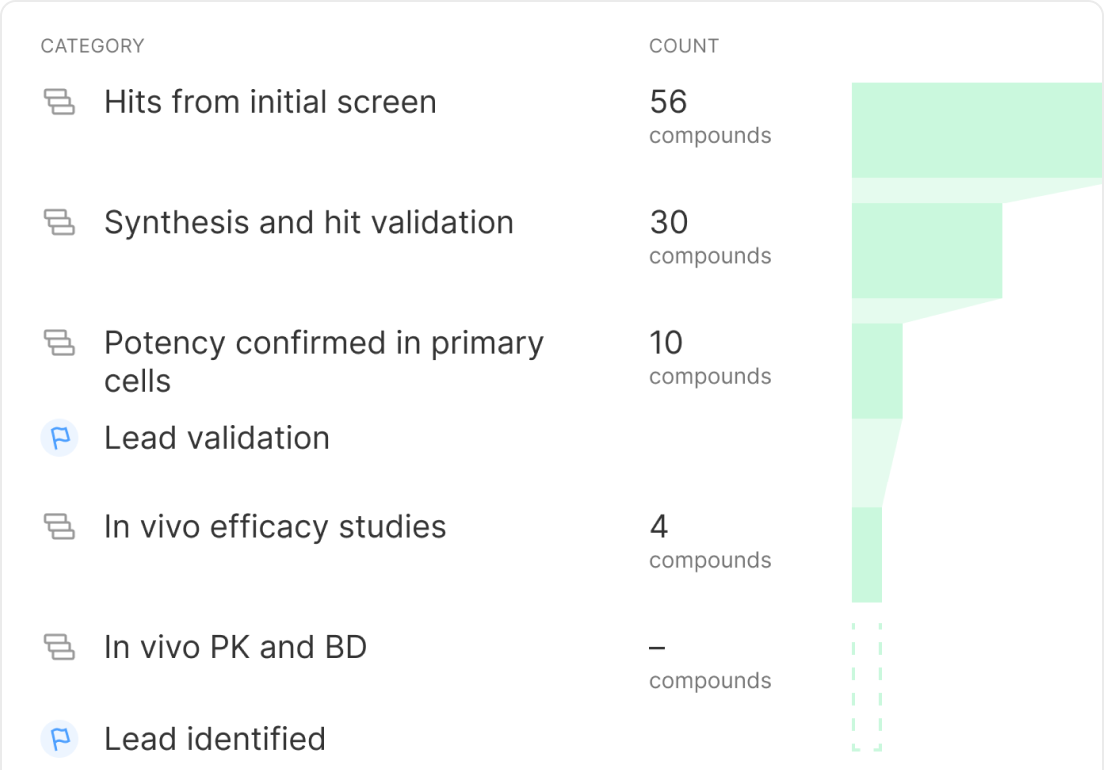
Powerful tools for aligning your team
Visualize pipeline stages
Capture decision history with notes